
Visitor Check-In Analytics at the Front Desk
Visitor Check-In Analytics at the Front Desk
Most front desks collect visitor data every day, yet few teams use it to improve the lobby. Visitors sign in, badges print, and hosts get notified. However, if no one reviews what happens between arrival and pickup, delays keep repeating. The lobby stays busy, but the root causes stay hidden.
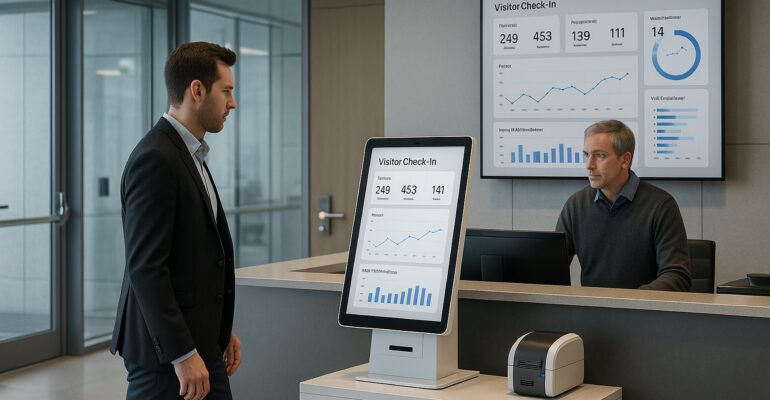
That is where visitor check-in analytics become useful. When a self-service kiosk captures timing, flow, and exception data, security and operations teams can see where the front desk slows down and what to fix first. As a result, the lobby becomes easier to manage, faster for visitors, and more predictable for staff.
If you want the wider platform context first, explore Sadevio’s features, available integrations, and the live self-service kiosk demonstration.
Why front-desk teams need better visibility
Reception issues often look random on the surface. Some mornings run smoothly. Others create long lines, slower handoffs, or repeated manual assists. In reality, most delays follow patterns. For example, one visitor type may need extra approval. A certain time window may overload the desk. Meanwhile, one site may handle arrivals better than another.
Therefore, teams need more than anecdotal feedback. They need clear lobby metrics tied to the check-in flow. A self-service kiosk can capture that data without adding more work for reception. Consequently, leaders can improve the process based on evidence instead of guesswork.
- arrival peaks by hour or day
- average time from check-in to host pickup
- manual assist rates by visitor type
- exception volume tied to missing approvals or policy steps
In short, analytics turn the kiosk into both an automated front desk and a source of operational insight.
How visitor check-in analytics improve the kiosk workflow
A self-service kiosk already guides visitors through sign-in, policy steps, and badge printing. In addition, it can record how long each step takes, where visits pause, and which workflows create the most staff intervention. That matters because the same data that powers a digital check-in can also improve it over time.
Moreover, visitor check-in analytics help different teams answer different questions. Facilities can measure lobby throughput. Security can track exceptions and escort-related delays. Operations can compare staffing needs across locations. As a result, the front desk improves without relying on trial and error.
Useful analytics often include:
- check-in completion time by visitor type
- time to host acknowledgment or pickup
- badge printing or approval delays
- manual intervention trends by shift or location
- repeat bottlenecks during peak arrival windows
Example scenario: a multi-tenant office lobby
A multi-tenant office receives guests, vendors, and interview candidates through one entrance. Before reviewing analytics, the team assumed the kiosk was fast enough. However, visitors still waited too long between badge printing and host pickup during late-morning peaks. Reception felt busy, but the exact cause was unclear.
After reviewing visitor check-in analytics, the team found that candidate visits often paused because hosts did not respond quickly enough, while vendors triggered more manual checks than expected. Therefore, the site adjusted notification rules, refined visitor instructions, and shifted staffing during the busiest window. In contrast to the old process, the lobby ran with fewer interruptions and clearer ownership.
Before vs after analytics-driven front-desk decisions
Before analytics
- Teams rely on complaints or informal observations.
- Reception feels busy, but leaders cannot see the exact bottleneck.
- Staffing decisions depend on habit instead of evidence.
- Process changes are hard to measure after rollout.
After analytics
- The kiosk shows where delays happen and how often.
- Teams can improve approvals, notifications, and lobby flow with confidence.
- Managers can compare sites, shifts, and visitor types more clearly.
- The front desk gets faster without losing control or consistency.
Overall, visitor check-in analytics help teams move from reactive problem-solving to steady front-desk improvement.
What teams should measure first
Not every site needs a large dashboard on day one. First, track the metrics that reveal where a visitor journey slows down. Second, compare those metrics by visit type. Finally, review trends often enough to catch recurring issues before they become normal.
- Check-in completion time: shows whether the kiosk flow itself is efficient.
- Check-in to pickup time: reveals handoff delays after arrival.
- Manual assist rate: highlights where staff still step in too often.
- Exception rate by visitor type: shows where workflows need refinement.
Additionally, these metrics support better communication across teams. Security, facilities, and reception can review the same facts and agree on the next fix. That shared visibility often matters as much as the metric itself.
Key takeaways
- Visitor check-in analytics help teams find and fix repeat lobby bottlenecks.
- A self-service kiosk can improve both front-desk speed and operational visibility.
- Data from the arrival flow supports better staffing, notifications, and process design.
- The automated front desk becomes more valuable when teams measure what happens after sign-in.
If your team wants a smoother lobby, start by measuring what the visitor journey already reveals. Specifically, when kiosk data is easy to review and act on, the front desk becomes easier to scale and easier to improve.
Ready to improve front-desk performance with better data?
See how Sadevio can help your team build a secure, professional automated front desk with practical visitor insights.